Silver Rally: Drivers, Market Setup and Forecasts
By Jack Cullen
Introduction:
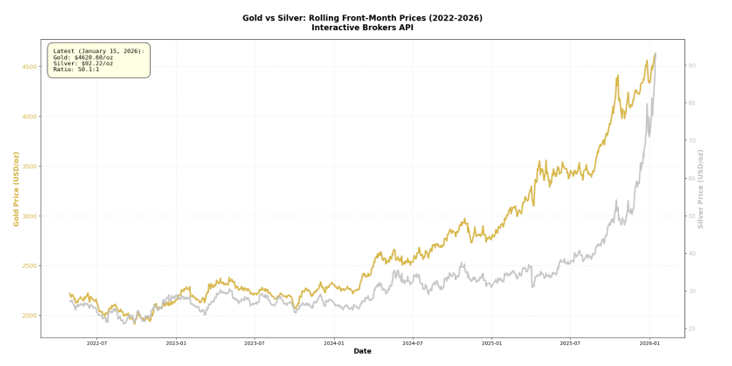
Precious metals have had an unprecedented rally over the last year, starting with the bull market in gold which has very much now moved into other metals, notably silver and platinum. As of writing, silver front month contracts are trading at about $100/oz on COMEX and LME, with considerable premiums in Asia. In the last twelve months gold has risen 65%, whilst silver has risen about 190%.
Regarding silver, there is a lot of talk about the structural deficit – the 2025 balance is estimated at 63–95 million ounces of undersupply – the fifth consecutive year of a deficit. The unique nature of silver as a commodity means the market will likely take longer to clear than usual. Obviously, this alone is a tailwind, but these forecasts have been in place for years, so traders must ask what the other factors are causing the violent rally since August 2025, before determining what upside there is from these levels.
Some of the other factors driving the price action include positioning, with both rumours and confirmations of various banks who couldn’t get the physical silver to hedge their short futures being forced to cover. There was also an extremely high gold:silver ratio in summer that likely attracted some mean reversion players.
However, I believe that the key factor driving this rally is debasement, with the industrial deficit acting as an accelerant. Debasement hedging was the primary driver of the gold rally through 2025, and as gold hit $4,300/oz we began to see increased flows into other metals such as silver and platinum (much less liquid and more volatile).
In this article I am going to examine the two key narratives that I believe have driven the rally so far – balances and debasement, whilst examining how much further we have to go – I think quite a lot. I will then look at the term structure, vol skew, geographical dislocations, positioning, volume and open interest, as well as some of the traditional macro drivers and some tail risks, explaining what I think these mean for shorter-term and longer-term prices.
Finally, I will give some trade ideas to play this rally if you have a bullish view still, particularly looking at the physical tightness of the market currently as it pertains to shorter term prices, gamma squeeze potential, and longer-term price levels.
Balances:
The structural deficit in silver markets has been talked about for years now, so I think it is foolish to attribute such a large price movement to this alone, but it clearly plays a meaningful role, at the very least amplifying the bull case from debasement alone. 2025 represented the fifth consecutive year of a structural deficit in the silver markets, one with has so far extracted over 800mn ounces from global inventories. The typical saying in commodity markets is “the cure for high prices is high prices”, yet silver presents a unique situation here where I don’t think this is necessarily true.
I will start on the supply side, where just under 75% of silver mine supply is secondary to copper, lead, zinc and gold, limiting the ability of silver supply to respond to market signals. Lead and zinc mines provide roughly 30% of silver supply, whilst another 30% tends to come from primary silver mines. Copper mines give about 25% annually, with gold mines providing just under 15%, with a small volume coming from other sources. Both gold and copper had great 2025’s and are at recent and all-time highs respectively, but still underperformed silver significantly. It is worth noting though that the same thing that allows silver to have much more violent rallies – it’s relative illiquidity, will also enable easing in its tightness with the increase in gold and copper mining activity that comes from proportionately smaller prices rises. However, lead and zinc are not at levels that is going to change mine production in a relevant way.
Global silver mine production has fallen at a 0.9% CAGR since 2020, whilst the demand side has had a CAGR of 3.6% from 2020-2024, as per the Silver Institute. Mining isn’t the only supply source though – 15-20% of total supply typically come from recycling. As prices rise the economic viability of recycling rises in a convex fashion, yet this effect will be partially offset by the recent increase in the dispersion of silver in industrial products. As I will explain in the demand side breakdown silver is a small component in a lot of photovoltaic cells and electronics, making recycling less efficient.
In terms of the production concentration and geopolitical risk for silver supply, the Americas dominate, with Mexico producing a quarter of global mine supply in 2025, with 60% of their production derived from primary silver mining operations. Peru, Bolivia and Chile, who have huge copper mining operations, are the largest producers in South America. The largest contributor outside of the Western hemisphere, and second largest producer globally, is China, at about 14% of global mine supply, which mostly comes from lead and zinc mining. The concentration in Mexico and China, as well as two of the next three largest suppliers being politically unstable (Peru and Bolivia), does pose risks for global supply disruptions, which likely add some small risk premiums for commercial buyers. Alongside the secondary nature of silver mining dampening the responsiveness to market signals, new primary mines take years to setup, so even extremely high prices won’t be able to quickly bring new primary supply to market.
Clearly there is significant tightness in the current market, with LMBA delivery times rising from a typical 2-3 days to over 4 weeks, whilst EFP spreads hitting record highs on CME are a product of the spot premium over paper – demonstrating how the rally is underpinned by those looking to hold physical silver, whether for debasement hedging or industrial purposes. Lease rates at 8% and the 1-year silver swap rate minus US interest rates at -8% further demonstrate how commercial players are increasingly willing to pay a premium to hold silver now.
Looking at the London market, which has only 155mn ounces in liquid inventory, physical depletion times will be 4/5 months if import flows cease. Given the fact that they will likely need to buy from China where silver is at an almost 10% premium, it seems that contracts on the LME are undervalued. Any supply disruption at these levels would trigger a legitimate crisis, and given the current geopolitical climate, especially the reassertion of the Monroe doctrine and China’s willingness to use its commodity leverage to pressure the West, supply disruptions seem more likely than they have been in previous years.
Moving on to the demand side, again the elasticity is the key reason for why a persisting imbalance is very possible. Only about 35% of silver demand comes from historically highly elastic segments – jewellery and physical investment. However, the current market regime will limit the substitution we see in these segments. The other 65% is from industrial use – mainly photovoltaics and electrical manufacturing which tend to be far slower to respond to price changes.
Starting with the industrial demand, solar photovoltaic demand has become the key driver of the silver imbalance – with it growing 289% from 2015 to 2024 and now being 33% of total industrial demand. Each photovoltaic cell requires silver in electric contacts and conductive pathways, with modern cells using only 10-13mg/W. That sounds small until you realise the scale of global solar installations – projected to exceed 191 GW annually. According to the Silver Institute, at prices of $94/oz, silver represents just under 30% of the manufacturing costs for photovoltaic modules. Most analysts suggest we are already exceeding demand destruction prices for photovoltaics. Yet here, the elevated base metal prices that pose a headwind on the supply side – through increased silver supply, reduce the ability of companies to substitute silver for copper. Solar cell producers also state that substituting to copper would pose technological risks, especially salient when considering the 20-year warranties that are often attached to these products. This means that the substitution that does occur will likely be low velocity.
The other key sector driving industrial demand is non photovoltaic electrical manufacturing, which has experienced 20% YoY growth driven primarily by electrical power generation equipment. This includes EVs, 5G infrastructure, data centre components, power grid equipment and consumer electronics. The elasticity profile here is similar to that of the photovoltaic demand in that any substitution that does occur will be low velocity, but most analysis suggests prices need to be well over $100/oz to see meaningful demand destruction.
This is for a few reasons. Firstly, silver possesses the highest electrical and thermal conductivity of any metal, making it the best option for high reliability electrical implements. In a lot of these segments, failure costs are exceedingly high – warranties, vehicle downtimes, data centre downtimes, network outages etc, so producers prioritise reliability over cost. Secondly, in a lot of the sectors that are buying the finished products, such as the automotive, aerospace and defence sectors, every significant change in electrode material or conductive paste composition requires formal re-qualification against electrical, thermal, and reliability standards, followed by design validation and production trials, which obviously makes the substitution process a very gradual one. Finally, industrial silver consumers have seen limited elasticity in response to any pass-through costs. Component makers for capacitators and inductors have reported raising prices from 15-30% yet not experiencing any fall in demand. This is because a lot of these components go towards final products like data centres, electrical grids and 5G grids that are experiencing explosive growth. Consequently, those building these products cannot afford any delays and are happy paying premium prices for a small but necessary component to ensure that production stays on track.
Jewellery is obviously a highly elastic market segment, both in terms of its demand and in how willing consumers are to recycle it. There will no doubt be consumers who stop buying jewellery altogether as a result of silver price levels, but substitution will be a challenge given prices of all precious metals are significantly elevated.
The other typically elastic segment is investment. However, the current market presents investors with a choice of 1% 1-year real rates on USTs (if you trust the CPI/PCE numbers), ATH stocks, incredibly compressed credit spreads, gold at ATH, massive bull markets in PGMs, base metals and uranium, and energy stocks that have massively outperformed their underlying commodity in the last 12 months. Furthermore, some analysts have pointed out that the nature of why some people buy silver may see it behave as a Veblen good in the investment market. The price action in the last year has given investors evidence that silver is trading as a debasement hedge (in a way bitcoin has not), and this could increase investors’ appetite to allocate some of their portfolio to it, whilst attracting CTAs and other momentum traders in the short term. Over the long run I don’t buy the Veblen narrative but think that it likely applies over the coming weeks and months. Instead, continued investment is more likely to come as awareness of the untenable fiscal situations of developed countries grows and investors realise that hyperinflation is a very real risk. All of this demonstrates how the typical paradigm of high prices = reduced demand and increased supply of a commodity does not apply to silver in such a linear fashion.
In terms of the future balances, the Silver Institute forecasts that the deficit will remain through 2026, with an expected deficit of 100-150Moz. The reduction in the deficit is forecast to come from falling industrial and jewellery demand (though they state that at least 60% of total demand from these segments will persist), whilst investment demand is forecast to rise steadily. There will likely be a small supply rise through some Mexican mines coming back online. Longer term, the balance will be contingent on where we see demand destruction emerge on the industrial side and how quickly photovoltaic cell and electrical manufacturers can substitute silver and enhance the efficiency of their manufacturing process such that less silver is needed. It will also be driven by the market regime and how investors relationship with debasement develops. Demand destruction can happen far quicker than supply can increase, so over the next 2-4 years it is the response of consumers rather than producers that will determine how the deficit moves. In fact, rapid moves on the supply side are more likely to be restrictive – China’s export controls are the key one to watch here.
Overall, the silver markets fifth consecutive year of deficit has liquidated most of the readily available inventories that it had built up in the previous decade. This almost entirely eliminates the markets buffer for any supply disruptions. If the market does come to an equilibrium in the coming years, it will almost certainly be because of demand destruction, yet, as explained, the confluence of factors driving silver balances make equilibrium far from a certainty. Whilst the demand for industrial manufacturing and jewellery will most likely fall sharply over the next few years, I am still very bullish, as I believe that we are going to see huge increases in the demand from investors, from central banks to institutional investors to treasury companies to retail. This is because of debasement.
Debasement, Gold and Silver:
Arguably (and in my view) the largest driver of the price action is debasement concerns – evidenced by the 7+% rise after news broke of a federal investigation into Jerome Powell. Debasement refers to central banks printing excess money, devaluing their currency in an attempt to keep yields low and stimulate the economy. Across all (maybe barring China) developed economies, democratic incentive structures, lax Keynesian monetary policy and in Europe lagging productivity growth has led to a situation where countries consistently have very high debt to GDP ratios coupled with central banks that have shown to be incredibly willing to print money and not at all willing to destroy it (see the Fed’s rapid movement from a completely incomplete QT back to QE – or Reserve Management Purchases as they call it).
Being the world’s largest economy and with the dollar as the global reserve currency, the US is clearly the most important figure here, with their policy choices having meaningful spillover effects to other economies. They also happen to be potentially the worst offender for currency debasement. Just since covid the Fed has printed about 40% of all dollars in circulation; this is a truly astronomical figure. This was done through QE, with the goal to bring real rates as low as possible and stimulate the demand side of the economy, as well as to keep yields low for a Biden administration that spend a total of $27.5tn over 4 years and ran a total deficit of $8tn. This has the effect of devaluing the dollar and hurting all those earning and saving in dollars – this excessive printing is a key reason for the cost-of-living issues across all Western countries in congruence with sky high asset prices, termed the “K-shaped economy”. The issue here is not just that the Fed printed money to stimulate the economy – it’s the fact that they are unwilling to then destroy that money once the assets they bought with it rolled off their balance sheet. Essentially, the Federal Reserve (alongside other developed CBs) have been borrowing from the future throughout the last few decades any time a crisis came up, but have been unwilling to pay the bills when they come due – which they do by destroying the currency they printed and keeping the money supply growth stable.
Moreover, the fiscal situation is clearly going to require more debasement – this is the key factor that is pushing more and more investors to the debasement trade – with Ken Griffin saying "Investors are scared that governments around the world have created too much debt, therefore nation states and central banks have to debase their currency in order to avoid default." The US currently has a debt to GDP of 130%, and total debt over $38tn. They have consistently run deficits of about 6-7% of GDP despite being at about 4% unemployment (4% unemployment generally is considered “full employment” by economists) or less every year since 2017 other than 2020. Debt interest is their number 2 fiscal expense after social security and projected to be 3.2% of GDP in 2026, and over 4% by 2035.
Despite all these crazy figures, the biggest risk factor here is the fact that more and more investors are waking up to how unsustainable the fiscal situations have gotten. This is evident not only in the rally in non USD safe havens but also in rates markets where curves have steepened over 2025 – bull steepeners across the West, with BoE, ECB and Fed in cutting cycles, whilst the Japanese yield curve bear steepened in the face of BoJ hikes and even twist steepened for a time in the “Takaichi trade” (Japan have 230% gross debt-to-GDP and about 130% net). This signals investors are demanding a greater term premium to account for sovereign risk and to maintain acceptable real rates of return. This behaviour can create what is known as a debt spiral – as investors become concerned about fiscal sustainability they demand higher yields, so governments are now paying more and more in interest, making their debt situation worse which then prompts investors to demand even higher yields. Once this spiral begins history has shown it is exceptionally difficult to get out of, so the increase in investor concern around fiscal sustainability will no doubt be what troubles governments and other investors most. Furthermore, the movement towards gold, silver and other “hard assets” is partially driven by CBs and pension funds selling USTs and buying gold. Money printing in response to this to try and stabilise yields will only push hard assets higher – yet another self-reinforcing mechanism of this trade.
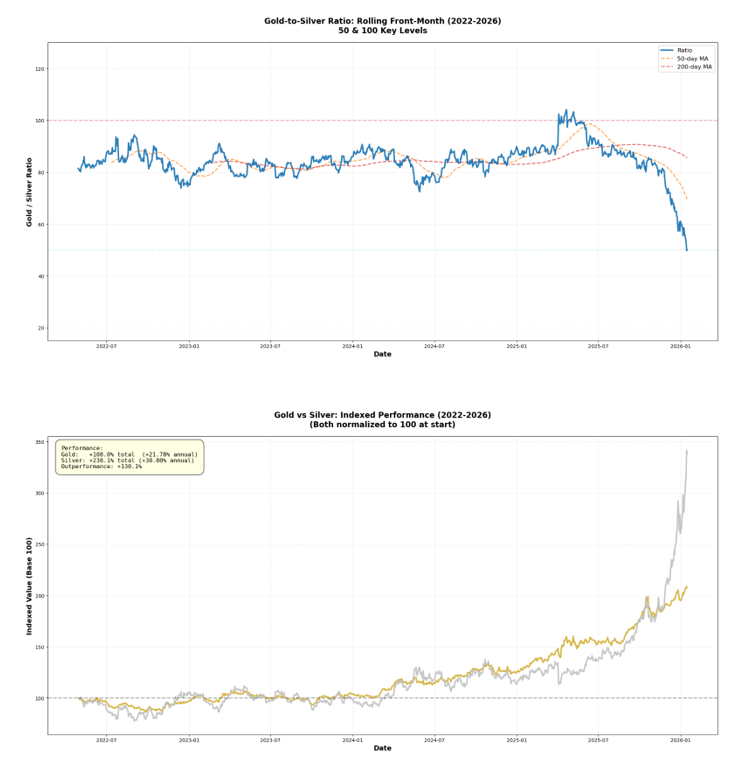
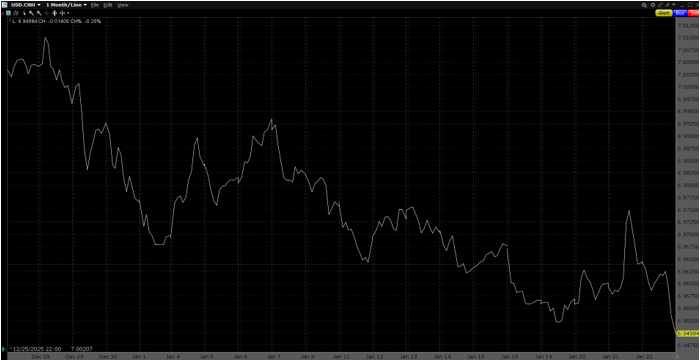
Whilst I could talk about why I believe this situation has come about (largely due to policymakers’ failure to identify and insulate economies from asymmetric democratic incentive structures), this piece is about silver. The first flows we saw from this debasement trade were into gold – with a lot of central bank buying driving the initial price action. The real silver rally began in August and seems to coincide well with the golden cross on the gold silver ratio – as seen in the chart below. There was a lot of talk of people buying silver outright or buying long silver vs gold pairs in April purely on the ratio hitting 100. This likely slowly moved momentum towards silver before more retail players jumped on the trade as they began liking some of the technical signals.
It’s clear that debasement fears are a large part of what is driving physical buying (whether directly or through ETFs). There have been some pullbacks since the initial rally there will no doubt be more, as we see profit taking, but I still see prices of both gold and silver rising from here over the coming years as fiat currencies grow weaker and weaker. The fiscal situations are not getting any better and still so few regular people are aware of what exactly has hurt them so much in terms of the cost of living since covid (the obscene increase in the money supply that largely went into assets). As more and more people realise this reality, they lose trust in fiat currencies and will want to store wealth and transact in hard assets.
Looking at the macro setup, the move towards military self sufficiency for middle powers is only adding to their deficits over the next few years. The already low real rate environment combined with the fact the US has $10tn of debt maturing this year and an ostensibly dovish incoming governor further adds to the case for shorter term acceleration in debasement.
In the very near term, rumours of the US looking to intervene in Japanese currency markets that have swirled post the NY Fed rate check on Friday – which would see the Fed print dollars or use sell assets, sell USD and buy yen, would only propel hard assets higher if it came to fruition. Devaluing your own currency is ideal for a government pursuing neo-mercantilism and who needs to re-finance over a quarter of its debt at the end of the year.
Currency debasement is still not talked about nearly enough and provides the strongest argument for why one should own hard assets like silver.
Vol Skew and Gamma Squeeze Potential:
When looking at options positioning it is surprisingly bearish – heavy put skew seen across all tenors, with the implied prices for April and May being between 60 and 70. I think this may present another tailwind. Investors realising that the rally is continuing may close out puts whilst they, or others, contemporaneously buy calls. This will require market makers to unwind their short futures positions (that they used to hedge their short puts) and buy futures to hedge the calls they write. This obviously pushes up spot and if enough begin to buy calls we could see a gamma squeeze, where the hedging from market makers pushes up the underlying, increasing their delta exposure (their negative delta will decrease even more) on their short calls position (due to the negative gamma market makers have here), requiring them to hedge more, which can create a squeeze that pushes up prices significantly. I think the fact that a number of banks have already been burned on shorts increases the likelihood of this, as they will have less appetite to take the other side if they see this dynamic developing. Furthermore, this skew is contraindicative of a rally driven by retail frenzy, like some media outlets are reporting.
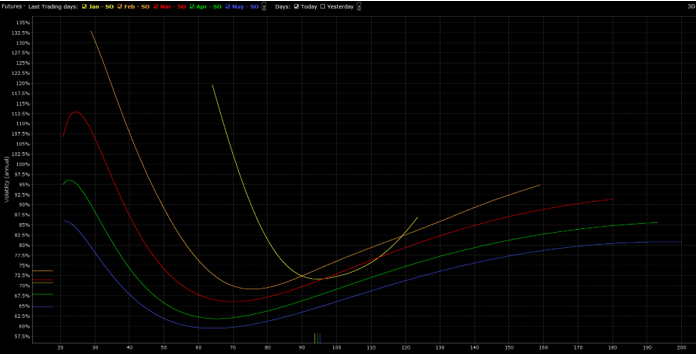
Source: IBKR
Macro and tail risks:
The traditional narrative behind precious metals, particularly gold, is that they act as safe haven assets and see inflows when geopolitical uncertainty becomes the preeminent concern among investors. I think that while this plays a role here – evidenced by the 3% rise on the Trump announcement of tariffs on Europe, following a 2% fall after the Greenland deal was announced, that the primary drivers for silver are clearly debasement and the deficit, so any sell off on geopolitical risk premiums falling represents a great buying opportunity.
Clearly the current macro climate is one of uncertainty and high geopolitical tensions, but precious metals markets tend to be exceptional at pricing these and have been through countless cycles of geopolitical uncertainty over the last few decades – they haven’t in any recent history been through the same regime of currency debasement we are currently experiencing, which is where I think the bulk of the upside from here likely comes from.
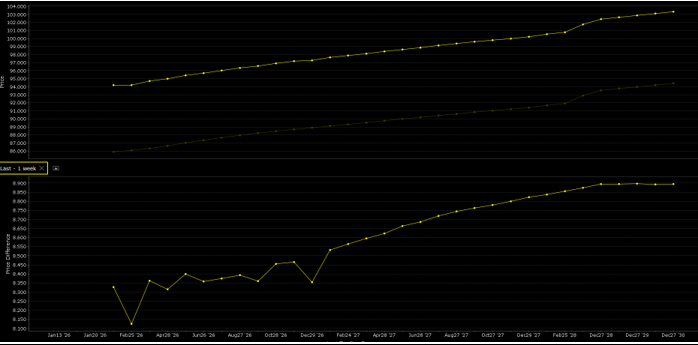
Another factor that I think is a very interesting tail risk to watch is the fact that Europe’s best economic weapon vs the USA is the number of treasuries European countries own (see below). Whilst Trump has just announced that he has scrapped 10% tariffs on European countries that were due to start in Feb on the back of the Greenland deal, there’s clearly a risk of further escalation between US and European tensions throughout the year.
If the US attempt to use the economic leverage they have over Europe again (particularly in natural gas with the massive shortages in Europe), or even use the substantial leverage they have over Canada (especially now they know they can access lots of heavy sour oil post Venezuela) we could see France, Ireland, Belgium and the UK threaten or agree to start dumping treasuries. In either scenario the jump in treasury yields would be massive. This would almost certainly result in the printers being turned on at the Fed, which would be hugely bullish for silver and gold.
Of course, to actually follow through with this, European countries would have to willingly take losses on their bond holdings to hurt the US, so it is likely that the threat of this is what could actually play out, but extreme escalation does create the possibility of actual selling.
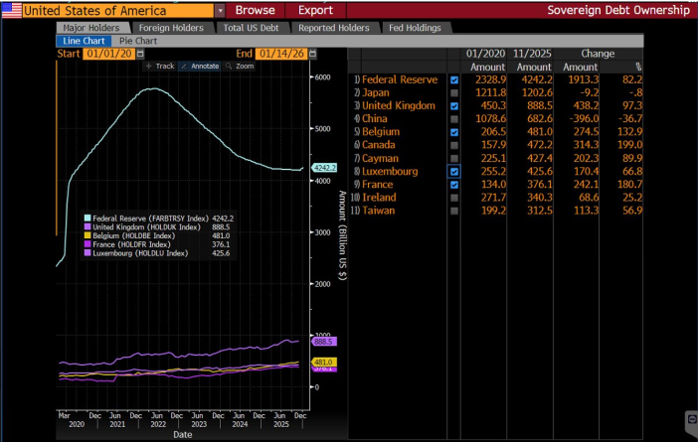
US Treasury Holdings, Source: Bloomberg
Finally, another macro factor to watch for is the renminbi vs USD. China is a net exporter of silver bullion (even post restrictions), but a net importer of certain products such as silver powder and paste. A stronger FX gives Chinese industrial buyers more purchasing power for products, whilst reducing the supply of Chinese exports, acting as a tailwind. Over the last few months CNH has strongly outperformed the USD and that likely augmented demand from Chinese buyers. In terms of the macro setup this year, the previously mentioned shorter term reasons for debasement (debt refinancing, trade surplus pursuit combined with a Fed perceived to be less independent, potential Yen intervention and already very low real rates in a cutting cycle) will act to weaken the USD. Chinese government debt to GDP is about 40% lower than the US’s which provides tailwinds, but the CNH also faces potential risks, notably a renewed crisis in the property sector or the potential for escalating US tariff policy that could reduce growth and demand more aggressive fiscal or monetary stimulus than we have already seen. USD vs CNH is certainly key to watch for silver traders, particularly in the case of any violent moves. Below you can see the CNH appreciation over the last month.
Source: IBKR
Geographical Arbitrage - Why the Western discount?
One of the clearest shorter term signals the market is giving us is the Shanghai premium. For context, Shanghai Futures Exchange (SHFE) silver has been quoted at equivalents of around $112 USD/oz after conversion, compared to COMEX and LME at ~$100 USD/oz. This premium widened significantly throughout 2025 and tells us a couple of things.
Firstly, the SHFE is a physical centric market, where contracts are designed for delivery. Typically, we see anywhere from 20% - 30% of SHFE contracts taken to delivery, compared to only 1% on COMEX. This spread isn’t purely a divergence of physical vs paper demand though – China also represents 50% of the worlds industrial demand, and tightness in the market leads to companies paying spot premiums. This dislocation is obviously bad for Chinese silver consumers, and the CCP has tried to use export restrictions to ease it, but to no avail.
Secondly, the fact that traders haven’t closed this arb yet demonstrates how high lease rates, freight rates and geopolitical risk (higher insurance costs) make a spread over $10 per oz unprofitable. Most of the cost preventing the arb is in the lease rates – highlighting just how limited the supply of physical silver is in the West.
Finally, we know that the “real” SHFE price tends to be a leading indicator for Western paper prices. That means we will likely see a convergence (or potentially Western prices exceeding Chinese ones if far more want to take their contract to delivery than expected) or a complete collapse of COMEX and LME prices if traders realise they can’t actually receive delivery here and are thus view them as “fake prices”.
This spread is very likely a positive signal for Western markets, with the extremely small chance that there is a collapse in futures prices as traders realise they are no longer tied to the physical market.
Contango:
The term structure of silver futures presents what I believe to be the most compelling, lowest risk opportunity. Commodity futures are priced by calculating how expensive it would be to hold that commodity on the delivery date. For example, if you wanted to have 5,000 oz of silver in March, you could buy the futures on Comex, Shanghai, LME etc and buy an EFP if needed. Or you could borrow money, buy silver today, and lease it to someone else until you need it in March, whilst paying for any requisite storage costs along the way. Storage costs are typically negligible in precious metals markets, unlike oil, so traders look at the lease rates vs the cost of financing. Currently, silver lease rates are about 450bps over the SOFR/SONIA (3.7%), as there is significant tightness in the physical markets. This should in theory push the curve into backwardation – signalling that consumers are willing to pay a premium for delivery now over later. As of writing this has yet to happen, as can be see below (from IBKR Silver COMEX contracts). There was some compression in the Jan 28th vs Feb time spreads today, but they are still only flat in a market with unprecedented tightness.
Source: IBKR
The longer lease rates remain significantly higher than financing costs, the more pressure there will be on the curve to invert. The fact that the curve is currently in contango likely indicates that the rally is still in early phases relative to the physical imbalance. Some analysts have suggested that the term structure could be driven by some consumer hedging going on at further out tenors, where there is less liquidity. I think this term structure not only presents a fantastic trading opportunity to short the time spread but also suggests that the rally still developing.
Open Interest and Positioning:
Positioning is one of the biggest reasons I am bullish on silver price action over the coming weeks. Despite the nearly 150% price rise since the start of September, speculators on COMEX have dramatically reduced net long positions. As of the most recent COT report from January 23rd, non-commercial (speculator) net longs stood at 25,214 contracts, down sharply from 32,060 contracts in the January 13th COT, and significantly lower than the net long 52,276 contracts in the September 23rd report - a 52% reduction despite triple-digit price appreciation.
This report showed net long positioning at a 22-month low, with longs collapsing 40% since the September 23rd peak, while shorts increased from last week, adding 2,474 short contracts for a total of 17,751. Open interest has also fallen since the silver rally begin, with the recent report showing OI of ~148k vs ~152k 12 months ago.
Prices rising dramatically in the face of this positioning data suggests to me that speculators are extremely wary of getting involved at these levels, and that the continued price rises represent physically driven demand, not speculative positioning. This presents large potential for net long accumulation over the coming weeks as momentum traders, CTAs and retail with FOMO eventually feel forced to participate.
If you go on X one of the big narratives, you will see is how banks are net short silver – this is ostensibly true as per the CFTC COT – banks show up as net short over 30k contracts and appear to already be aggressively covering. Banks looking to close out 30k contracts in a market with falling volume is obviously a recipe for a squeeze. Industry professionals generally rebut these claims by explaining how banks are typically short the futures to make markets for clients, hedging with the physical. One issue here is that the physical vs paper spreads are so much larger than any spread the banks would capture when making markets. This means as the futures converge to the spot price, banks will be losing money. Clearly then banks are short in a market that they don’t want to be short in (evidenced by their 32% covering over the last 12 weeks on COMEX). This obviously will provide some upside price pressures over the coming weeks.
Overall View:
At the time of writing, I am still very bullish silver. It is undoubtably difficult to parse apart how much of the price action so far has been debasement driven, a cause of industrial tightness or retail hype, but I certainly feel there is still room to run, especially on the debasement front. This is not to say there won’t be pullbacks on profit taking and fears of it being overbought, but that I think the trajectory is still a positive one from these price levels.
Starting with the debasement angle, the chart below conveys exactly why I think there is so much room to run. We are at the precipice of a genuine regime change in terms of currency value that we haven’t seen in the last 100 years, for all the reasons laid out in the debasement point, and silver is yet to fully price in the money supply expansion that has already happened, never mind the coming debasement. On top of this, the only apparent way out of severe currency debasement is extreme productivity growth from AI development, which would require exponential growth in the power supply, in data centres and in grid resilience, all of which currently use silver.
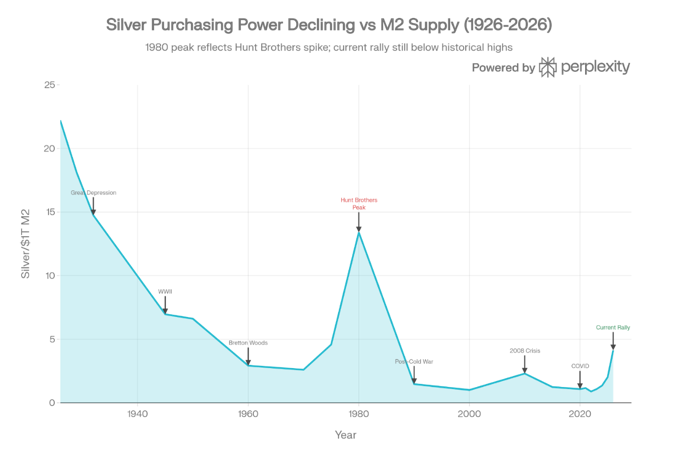
Source: Perplexity
Secondly, as the analysis on the deficit suggested, the short term risk to industrial balances is very much on the deficit side, where concentrated supply in Mexico and the west of South America, combined with the risks of Chinese export restrictions, are factors that will have silver consumers willing to pay a premium to hedge. Over the long run, meaningful changes will come from demand destruction, but this will be slow to manifest due to the elasticity profile on the industrial side and is unlikely to happen on the investment side.
In terms of the technical indicators, we are at an RSI of about 72 at the time of writing, signalling overbought conditions, yet we also have just seen the MACD line cross above the signal line again and nothing of note in any moving average crosses. Whilst we may see some fade this rally just from a mean reversion perspective and thus will experience some sell offs, I think this is a genuine regime change and so reduces the signal technical indicators provide. Overall, I am bullish silver over the coming few weeks and as a longer-term investment in this macro climate, largely due to my high conviction in debasement trades. I think front month prices in the high $110s/oz could be seen in the coming weeks.